DRAW OUT IDEAS TO EXPLORE AND UNDERSTAND
Sketch, doodle, and label diagrams that address your questions and help you see what you and others think about the situation. If your problem focuses on people, draw out people, their roles, motivations, and incentives. If your challenge is about your competitors illustrate what they are doing, and what you can do differently. If your challenge is strategic create maps to see options.
POINT
Use points to make a point. Good points stand out. Useful chunks are easy to read and understand.
LINE
Use lines to arrange, sequence, and sort things. Lines establish a simple linear scale to place objects, events, actions, and people.
ARROW
Arrows show flows. They depict movement from a stream of tangible things such as water, traffic, and money as well as the flow of the intangible such as information, attention, and trust.
SQUIGGLE
Use curvy lines to chart the relationship between two factors. Think of squiggles connecting qualities and quantities: stock price and time; product popularity and maturity.
TRIANGLE
Use triangles to bring together three factors visualizing their differences and tradeoffs, or when you want to make a meaningful hierarchy.
2x2 Matrix
Two by two matrices sort out dilemmas by pulling apart complementary or contradictory qualities.
CIRCLE
Use a circle to visualize proportions, chart recurring or cyclical events, or illustrate layered systems.
BLOBJECT
To intuitively describe the loose relationship between several qualities use blobs. Creatively vary size and shape, and overlap.
SWIMLANES
Use swimlanes when several factors need to be understood and managed in parallel. They are ideal for project management, customer journey mapping, and data visualization.
FLOWCHART
When you want show the steps of how something happens or how you’d like something to happen, use a flowchart.
MINDMAP
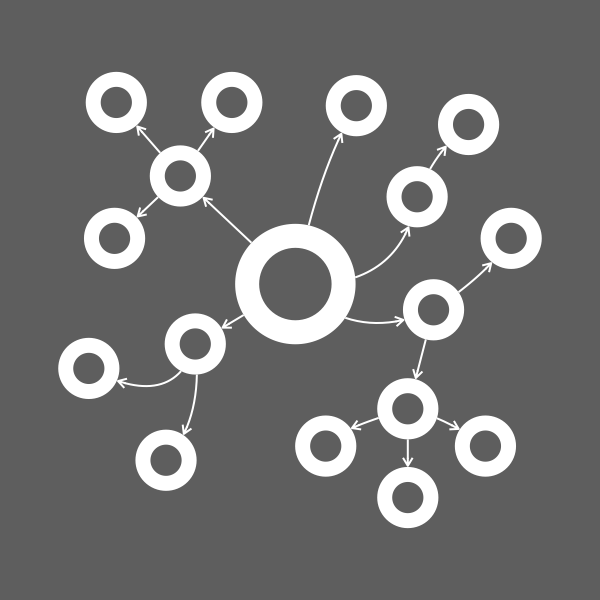
Mindmaps organize ideas around a single central organizing theme. Topics extend outwards branching into organic patterns.
MAP
Use maps to orient and way find. A sketch can place objects in a room, building, city, or country as well as in the space of imagination.
HIERARCHY
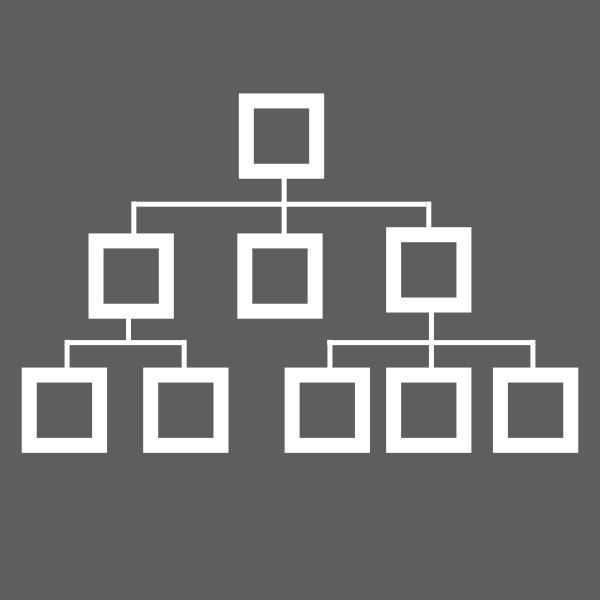
When you want show the steps of how something happens or how you’d like something to happen, use a flowchart.
FISHBONE
To illustrate how something happens or how you’d like something to happen, use a flowchart
SYSTEM
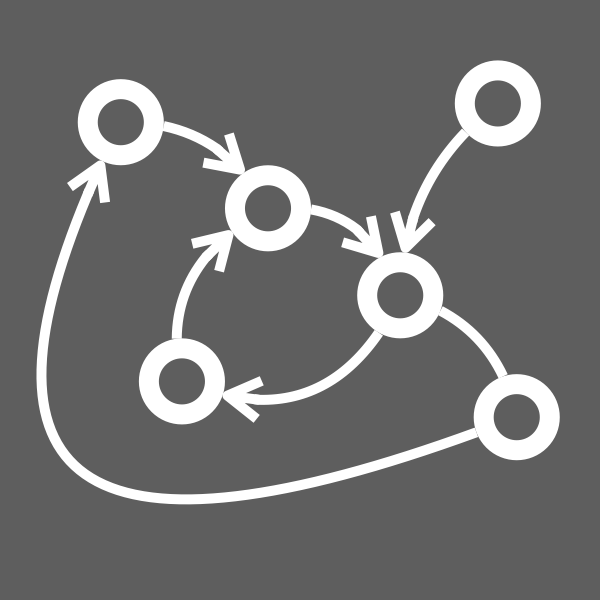
When you want show the steps of how something happens or how you’d like something to happen, use a flowchart.
METAPHOR
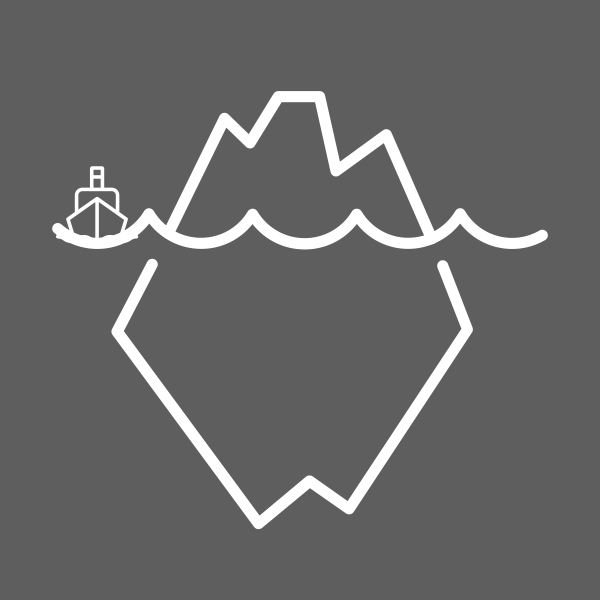
Select an object or system to use as a framework to understand another system.
ILLUSTRATION
A sketch, drawing, or schematic often describes ideas more clearly than text or charts can alone.
CRAZY EIGHT
A sketch, drawing, or schematic often describes ideas more clearly than text or charts can alone.
PERSON
When studying a problem, draw out people. Human figures instantly humanize drawings. They make them inviting, accessible, and establish a personal context.
FACE
We respond instantly and viscerally to emotion. Use faces to show how people feel.
CANVAS
Canvases are visual templates to describe and design important elements of a system.


